LMSAvailable now
Faculty Reports gives every teacher a single dashboard showing what is due right now — the grading queue oldest first, today's live classes with a join link, discussions nobody has answered, and the students slipping behind — plus two role-aware reports inside each course: a Course Report for whoever teaches it and a My Report for each student. It answers the question Moodle's own reporting does not: not what happened, but what needs doing next.
Key takeaways
- A per-teacher dashboard with the grading queue, upcoming live classes, unanswered discussions and at-risk students in one place.
- A Today & Upcoming timeline carrying live classes with a join link, office hours, exam windows and assessment dates.
- Quick actions that deep-link straight into the right Moodle page for the course in focus — schedule a live class, create an assessment, check attendance.
- Two role-aware reports per course from one navigation entry: Course Report for graders, My Report for students.
- Managers can open any faculty member's dashboard read-only, with a department-level overview above it.
- Live classes and attendance read from BigBlueButton, Zoom or calendar events, auto-detected.
Why we built it
Moodle is not short of reports. It has a gradebook, activity completion, logs, participation reports and a competency framework underneath all of it. What it does not have is a screen written for the person who has to teach on Monday.
The existing reports are organised around administrative questions: what happened, to whom, when. A teacher's question is a different shape. What have I not graded, which live class is next, which discussion has been sitting unanswered for four days, and which of my forty students should I contact today? Answering that in stock Moodle means the gradebook, then each assignment grading screen, then the forum, then the calendar, then the participation report — and holding the result in your head.
So teachers mostly don't. They grade what appears in a notification, they answer the forum posts they happen to see, and the student who quietly stopped logging in six weeks ago surfaces at the end of term, when it is too late to do much about it.
Faculty Reports collapses that into one dashboard, one report per course and one report per student. The same data Moodle already holds, assembled around the decision instead of around the record.
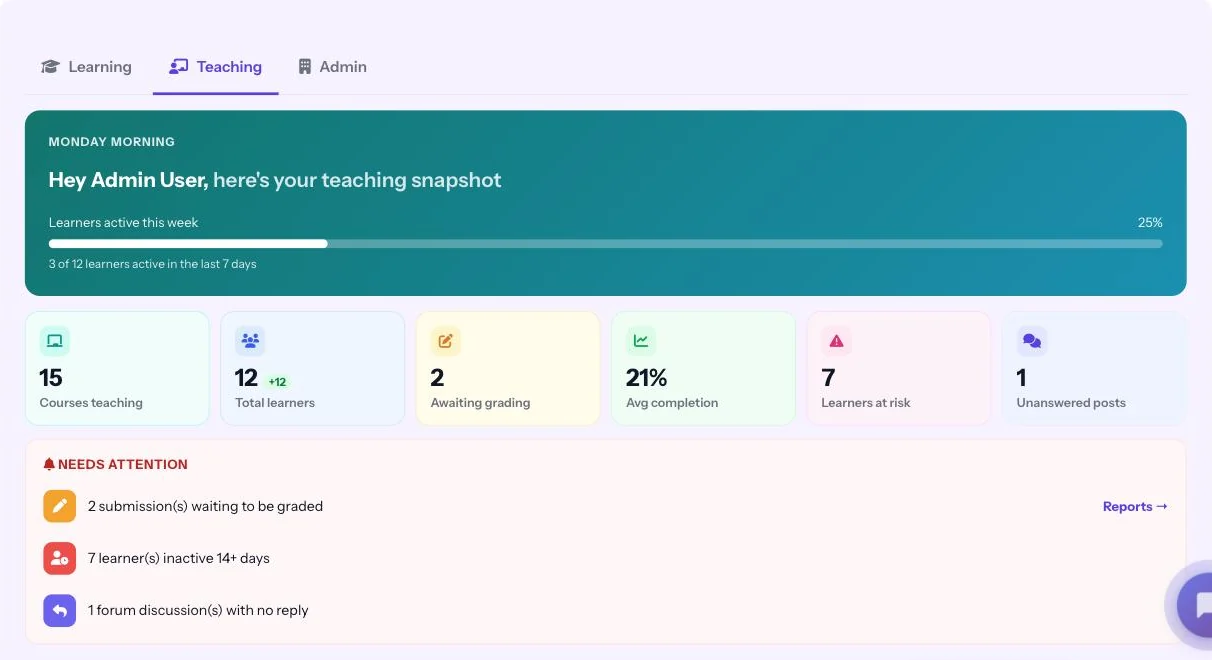
The dashboard: what is due, right now
Course focus
A course selector sits at the top, defaulting to all courses. Everything below rescopes to whatever is selected, starting with four live counters: live classes upcoming, assignments to review, new discussion posts, and quizzes to grade.
Next to them sit quick actions that deep-link into the correct Moodle page for the course in focus rather than dropping you at a menu: Review Assignments, Check Attendance, Post in Discussion, Upload Course Content, Schedule Live Class, Create Assessment. The point is to remove the navigation, not to add another summary screen on top of it.
Needs your attention
Four tiles — To Grade, Unanswered Questions, At-Risk Students, Next Live Class — sit above a tabbed worklist:
- Grading — oldest first, grouped by section, so the submission that has been waiting eleven days is the one you see, not the one that arrived this morning.
- Discussions — unanswered questions with their age, because an unanswered question in week two is a different problem from one posted an hour ago.
- At-Risk — auto-flagged students; click a name to open their full record.
- Overdue — non-submitters, content still unpublished, assessments still unbuilt. The things nobody is chasing you about yet.
Today & Upcoming
A timeline of live classes with a join link, office hours, exam windows and assessment dates. Live sessions are read from BigBlueButton, Zoom or plain calendar events, auto-detected — so a site running Zoom for some programmes and BigBlueButton for others does not need two answers. Where Zoom is the source, attendance can be synced back from its participant reports with a minimum-minutes threshold you set, so a learner who joined for ninety seconds is not recorded as present.
My courses, and insight
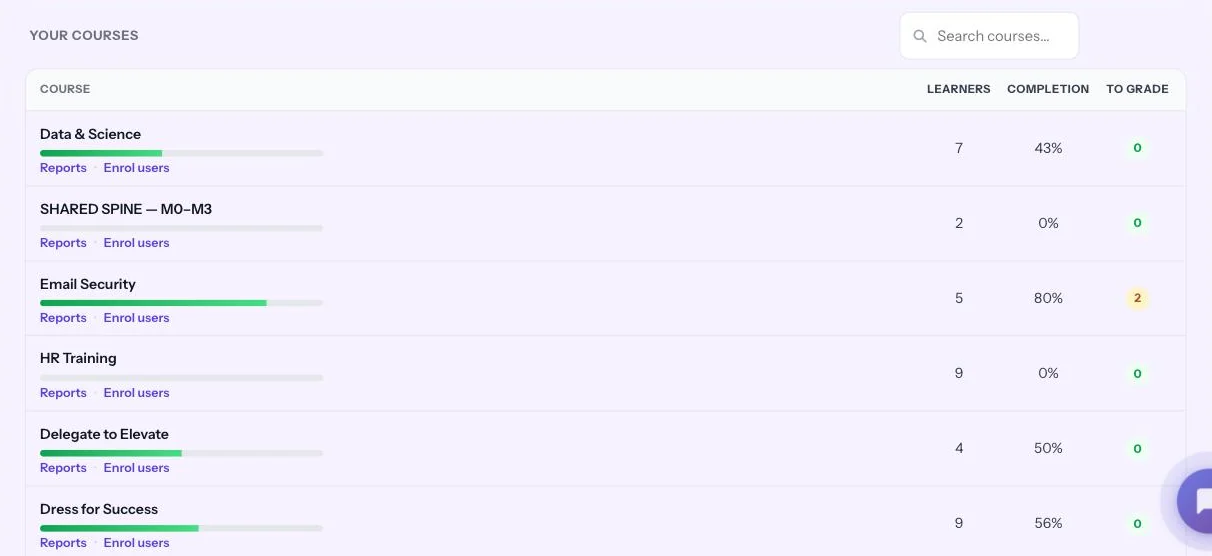
Course cards carry content-delivered percentage, student count, average score and at-risk count; clicking one sets the course focus for the whole page. Below that, a section-by-section performance comparison and a monthly engagement panel — active students, content views, assessments taken, average score — each with a trend against last month, filterable per course.
Student 360
Clicking any flagged student opens attendance, average score, last login, missed deadlines, forum posts and score trend, with the reasons they were flagged and their recent activity. From there you can send a nudge or open the full record without leaving the page.
For heads of department
A manager or admin can open any faculty member's dashboard, read-only, with a clear notice showing whose view they are in. Above it sits a faculty overview: teaching staff, total still to grade, total at-risk across the department, and a list of every teacher with their own course count, student count, grading backlog, unanswered questions and at-risk figures.
That turns "how is the semester going" from a round of emails into a page. It is also the honest place to notice that one member of staff is carrying four times the grading load of everyone else.
The two reports inside every course
One menu entry, different reports
A single node appears in each course's secondary navigation, and what it opens depends on who clicked it. A grader gets Course Report for the whole cohort. An enrolled student gets My Report — their own standing only. Anyone with neither role sees no node at all, rather than a link that leads to a permission error.
Because the node is created by a plugin callback rather than a theme edit or a hardcoded link, it appears and disappears cleanly with the plugin. Nothing to unpick from your theme later.
Course Report
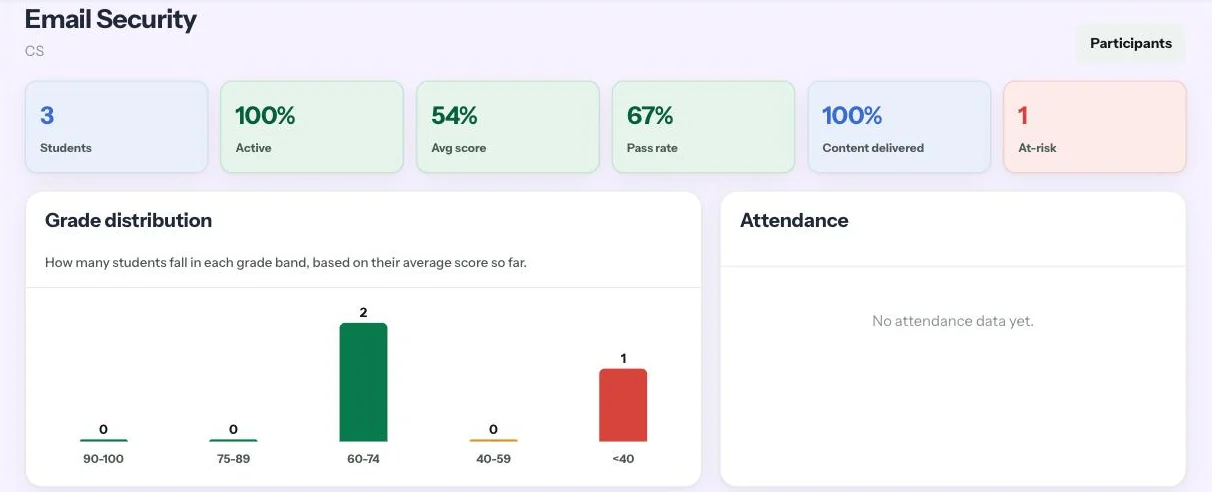
- Roster with per-student standing — overall grade, attendance, progress and status, searchable and paginated so a course with hundreds of students stays usable.
- At-risk list with reasons. Every threshold is configurable: minimum attendance, days since last login, minimum score, score-drop percentage, missed-deadline count. The report says why a student was flagged, not just that they were.
- Class ranking — position, grade, attendance and status, with ties sharing a rank and students without a course total listed last rather than quietly dropped.
- Assessments — every assignment and quiz with due date, status, grade and the class average for that item.
My Report
The same course from one seat: overall grade and attendance against the class average, progress by section, every assessment with its status, per-session attendance detail, upcoming live classes, an eight-week activity chart, and a plain focus-areas list — overdue work, missed sessions, low attendance, stale access.
A teacher opening the same page for a named student gets everything above plus a faculty-only block: risk level, the reasons behind it, the full submission history, and a nudge button.
Nudge
The action most often missing from a report is the ability to act on it. Nudge opens a dialog with the student's name and an editable message — leave it blank and a standard template goes out. It reports its own progress, and when delivery fails it says whether the student is not enrolled or whether their own notification preferences blocked it, rather than showing one generic error.
Two decisions worth explaining
Class averages and ranking disappear below five students
Both are suppressed in any course with fewer than five students, and the reason is arithmetic rather than caution. In a group of three, publishing the class average alongside a student's own grade tells them their classmate's grade. Rank does the same thing faster. A small-cohort course silently loses those two elements instead of quietly leaking one student's results to another.
Students never see another student's name, score, rank or percentile anywhere in the plugin — only aggregate class figures, and only when the cohort is large enough for aggregate to mean anything. The userid parameter on the student report is rejected outright for anyone without grading capability in that course, so the URL cannot be edited into someone else's record.
The activity chart is columns, not two lines
The obvious way to show a student against their class is two lines on one chart. We built that, looked at it, and threw it away: the two series sat close enough together, in colours near enough to each other, that reading which was which took real effort.
It is now columns for the student and a dashed reference rule for the class average, with the value printed on top of every column including the zeros, labelled axes, a one-sentence plain-language summary above the plot, and a collapsible table of the weekly numbers underneath for anyone who wants raw figures or is reading with a screen reader. A chart nobody can read is not a report.
- 1Install the plugin
Copy it into local/edzfaculty in your Moodle root and run the upgrade from Site administration, then Notifications. It creates two cache tables of its own and touches no core data.
- 2Purge caches
php admin/cli/purge_caches.php — the in-course navigation entry will not appear until you do.
- 3Prime the cache once
Run the refresh task by hand for the first pass rather than waiting for cron, so the first teacher to open the dashboard sees real figures instead of an empty page: php admin/cli/scheduled_task.php --execute="\local_edzfaculty\task\refresh_cache"
- 4Check the capabilities
Viewing is granted to teacher and editingteacher by default, viewing any faculty member's dashboard to manager, and settings to admin. If your site uses custom roles rather than the standard ones, assign them explicitly.
- 5Set terminology and thresholds
Site administration, Plugins, Local plugins, Faculty Dashboard. Choose academic wording (Students / Sections / Semesters) or corporate (Learners / Batches / Programs), then set the at-risk thresholds to match how your institution actually defines falling behind. The defaults are a starting point, not a policy.
- 6Point it at your live-class source
Live classes are read from BigBlueButton, Zoom or calendar events. Attendance can come from mod_attendance, from Zoom participant reports with a minimum-minutes threshold, be auto-detected, or be switched off entirely.
- 7Open the dashboard, then a course
Visit /local/edzfaculty/index.php as a teacher for the cross-course view. Inside any course, the Course Report entry appears in the course menu; click a student name from there to reach their full report — the same route works by keyboard.
What it needs
- Moodle 5.0+ and PHP 8.1+.
- Optional integrations, all feature-detected rather than required:
mod_attendance,mod_bigbluebuttonbnormod_zoom,mod_forum,mod_assign,mod_quiz. Missing ones are simply not shown. - Figures are cached with a six-hour default TTL and a throttled manual refresh, so a large site is not recomputing cohort statistics on every page load.
- A privacy provider is implemented, and uninstalling drops both cache tables and leaves core data untouched.
Set the thresholds before you show it to faculty
The at-risk defaults are deliberately generic. Run them against one real course first and look at who gets flagged — a threshold that marks half the cohort as at-risk trains teachers to ignore the list, which is worse than not having one.
Frequently asked questions
Does it show upcoming Zoom or live class sessions?
Yes. Upcoming live classes appear as a counter on the course focus bar, as a Next Live Class tile, and on the Today and Upcoming timeline with a join link. Sessions are read from BigBlueButton, Zoom or calendar events, auto-detected, so a site using more than one of them still gets a single timeline.
How does the grading queue decide what to show first?
Oldest first, grouped by section, so the submission that has been waiting longest surfaces rather than the one that arrived most recently. Non-submitters, unpublished content and unbuilt assessments sit on a separate Overdue tab.
Can attendance come from Zoom rather than mod_attendance?
Yes. Attendance can be synced from Zoom participant reports with a configurable minimum-minutes threshold, so a learner who joined briefly is not recorded as present. mod_attendance, auto-detect and off are the other options.
How is this different from Moodle's built-in reports?
Moodle's reports are organised around records — what happened, to whom, when. This is organised around a decision: what is due, who needs attention, and what should be done about them. It reads the same underlying data and puts the action next to the finding.
Can students see each other's results?
No. Students see their own figures and aggregate class averages, never another student's name, score, rank or percentile. Averages and ranking are suppressed entirely in courses with fewer than five students, because in a small cohort an average discloses an individual grade. The student report also rejects an edited userid parameter for anyone without grading capability in that course.
Can a head of department see across all teachers?
Yes. Managers and admins get a faculty overview with department totals and a per-teacher breakdown, and can open any individual teacher's dashboard read-only with a notice showing whose view they are in.
Does it work for corporate training as well as academic courses?
Yes — a terminology setting switches the whole interface between academic wording (Students, Sections, Semesters) and corporate wording (Learners, Batches, Programs). The logic is identical; only the language changes.
Will it slow down a large site?
Cohort figures are computed by a scheduled task and cached with a six-hour default TTL, with manual refresh throttled. Long tables paginate client-side, so a course with hundreds of students renders like a course with twenty.
What's next
The roadmap runs toward AI grading assistance and integrity flags, more precise manual-grading counts for quizzes, configurable report export, and block versions of the To Grade and At-Risk widgets so they can sit on the standard Moodle dashboard.
Want to see it against one of your own courses?
Book a Free Demo